

Skip to financial highlights
Samruk Energy
EN

Financial 
highlights

Financial and economic indicators7

Financial and economic indicators for 2023–2026, million KZT
Indicator, mln KZT2023 (actual)2024 (actual)2025 (actual)2026 (forecast)
Income from the sale of products and the provision of services444,960573,490752,843774,950
Cost of products sold and services rendered329,676371,645487,420558,492
Gross profit115,284201,845265,424216,459
Operating profit 92,828172,987225,777173,267
Earnings before depreciation, amortisation, interest and CIT (EBITDA)159,484226,241314,866285,796
Profit (loss) before tax63,082147,524205,355157,273
Corporate income tax expenses19,35234,55547,70936,470
Total profit (loss) before minority interest43,730112,969157,645120,802
Minority6494612,8471,344
Total profit attributable to Group Shareholders43,080112,508154,798119,459
  1. For more information on Financial and Economic Indicators, please refer to the Annual Financial Statements

Income from the sale of products and the provision of services by "Samruk-Energy" JSC in 2025 amounted to 752,843 million KZT

Revenue from products and services in 2025 From 573,490 million KZT in 2024 through five sources of growth to 752,843 million KZT in 2025. 573,490 Actual
Revenue 2024 59,869 Electricity
& heat gen.
(PGO) 8,855 Capacity
sales (PGO) 35,513 Electricity
transmission (TSO) 59,048 Electricity
sales (RES) 16,068 VPS +
Other 752,843 Actual
Revenue 2025
Revenue increased from 573,490 million KZT in 2024 to 752,843 million KZT in 2025; the chart shows five contributions to this change.

The increase in consolidated revenue was mainly in the sales segment, the revenue growth was associated with an increase in electricity sales volumes by 1,079 million kWh (12%) and the tariff for electricity sales Branch of Alatau Zharyk Company JSC-Energosbyt from 28.03 KZT/kWh to 30.97 KZT/kWh (an increase of 10%).

The increase in revenue from electricity transmission is associated with an increase in electricity transmission volumes by 688 million kWh (7%) and the tariff for electricity transmission of Alatau Zharyk Company JSC from 
9.95 KZT/kWh to 12.83 KZT/kWh.

In the electricity generation segment, revenue growth was due to an increase in sales of hydroelectric power plants due to an increase in EPO marginal tariffs from 1 February 2025, as well as due to an increase in capacity sales volumes based on the results of trading for 2025.

Also, an increase is observed in the heat production segment due to an increase in the sales volume of Almaty Electric Stations JSC and Energy Solutions Center LLP (Ekibastuz CHP). In addition, the tariff of Almaty Electric Stations JSC for heat energy increased from 5,195 KZT/Gcal to 5,539 KZT/Gcal.
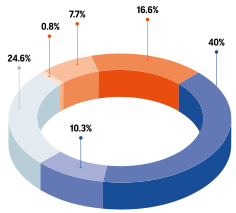
Income structure for 2025 by main activities

Income structure in 2025
Electricity generation Transmission and distribution of electricity Electricity sales Heat generation COAL MINING Other

The six income categories are listed in the legend beside the chart.

Income from the sale of products and the provision of services by producers

Indicator, mln KZT 2023 (actual) 2024 (actual) 2025 (actual) 2026 (forecast)
Income from the sale of products and the provision of services 444,960 573,490 752,843 774,950
Ekibastuz GRES-1 LLP 186,939 198,847 246,631 275,120
Branch of JSC "Alatau Zharyk Company"- Energosbyt 168,309 247,127 307,166 356,751
Almaty Electric Stations JSC 96,660 125,605 139,513 154,656
"Alatau Zharyk Company" JSC 67,712 94,009 129,111 145,064
Moynak HPP JSC 21,720 25,768 26,196 17,882
Shardarinsk HPP JSC 8,991 8,602 7,137 8,357
Ust-Kamenogorsk HPP LLP 10,915 12,794 12,616
Shulbinsk HPP LLP 16,603 18,429 18,328
First Wind Power Plant LLP 6,170 6,641 7,826 8,574
"Bukhtarminskaya HPP" JSC 21,837 16,520 93,693 43,590
Energy Solution Center LLP (ETEC) 4,233 9,512 11,795
Branch of Energy Solution Center LLP - SSC 1,595 1,945 2,643 3,729
Samruk-Green Energy LLP 500 659 814 797
Intra-group turnover (elimination) 135,475 183,986 248,622 282,309

The main share in the income from the main activities of the Company is occupied by Ekibastuz GRES-1 LLP, Almaty Electric Stations JSC, Alatau Zharyk Company JSC, branch of Alatau Zharyk Company JSC-Energosbyt. At the same time, when consolidating income, intra-group turnover is excluded from the total amount, mainly for energy producing and distribution companies.

Cost of production and provision of services

Indicator, mln KZT 2023 (actual) 2024 (actual) 2025 (actual) 2026 (forecast)
Fuel 91,379 107,507 143,961 159,826
Remuneration and related expenses 53,766 70,084 95,143 108,931
Cost of purchased electricity 56,404 57,128 44,268 41,747
Electric Power Availability Services 8,848 2,822 23,320 26,650
Depreciation of fixed assets and depreciation of intangible assets 62,556 58,033 78,029 100,064
Repair and maintenance 11,377 12,993 18,958 17,494
Electricity transmission services 16,922 19,828 27,959 34,904
Materials 2,777 3,373 5,020 5,787
Water supply 7,582 10,625 13,000 15,864
Network losses 2 0 0 0
Taxes other than income tax 4,633 6,055 7,727 10,701
Payment for emissions into the environment 4,435 5,054 8,038 9,243
Third-party services 3,350 11,985 13,949 15,857
Other 5,643 6,159 8,047 11,423
Total 329,676 371,645 487,420 558,492

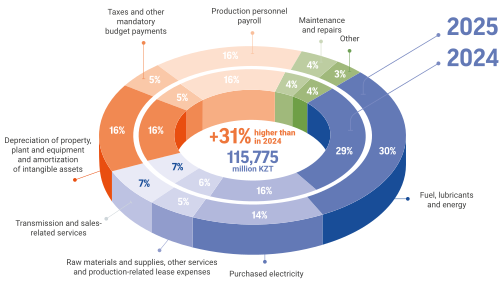
Cost of sales at the end of 2025 amounted to KZT 487,420 million, which is 31% higher than in 2024. as well as the revision of the payroll of production personnel in connection with the increase in the approved tariff, indexation of prices for raw materials and production materials. The increase in expenses was driven by higher variable production costs (coal, gas, KEGOC services, etc.) due to rising prices for goods and services, expenses in the balancing electricity market, and higher production personnel remuneration due to annual inflation indexation, as well as the revision of the production personnel payroll following the increase in the approved tariff and the indexation of prices for raw materials and production materials.

Depreciation and amortisation for 2025 amounted to KZT 78,029 million, an increase of KZT 19,996 million or 34% compared to the same period last year. The main increase at Ekibastuz GRES-1 LLP was due to the commissioning of facilities related to current extended repairs according to the repair schedule, as well as the recalculation of depreciation on the chimney.

Cost Structure

Cost structure in 2025 and 2024; total 115,775 million KZT, 31% higher than in 2024.

Forecast for the future period In the forecast for 2026, the cost of production is increasing due to rising prices for goods and services, the cost of purchasing balancing electricity at BDT, an increase in the cost of remuneration of production personnel, as well as due to an increase in production volumes.

Selling expenses, million KZT

Sales expenses at the end of 2025 increased by (2,263) million KZT (by 26%) compared to 2024 and amounted to 11,108 million KZT. This deviation is due to a decrease in the cost of KEGOC's services for balancing electricity production and consumption due to a reduction in the tariff.

Selling expenses, million KZT

8,93120238,845202411,108202512,9982026forecast

Forecast for the future period In the forecast for 2026 Expenses for the sale of products are planned in the amount of 12,998 million KZT, which is higher than the fact of 2025 by 1,890 million KZT or 17%. The increase in sales costs is due to an increase in prices for KEGOC's services.

General and administrative expenses, million KZT

13,525202320,013202428,538202530,1942026forecast

Forecast for the future In the forecast for 2026, administrative expenses are higher than the level of 2025 by KZT 1,656 million The increase is mainly due to the indexation of wages as part of the provision of social support to employees of subsidiaries and affiliates.

Financial expenses, million KZT

Finance expenses at the end of 2025 amounted to KZT 35,369 million, which is KZT 4,047 million higher than the actual value for 2024. The increase was due to the attraction of debt financing to cover cash gaps in the ALES, as well as due to the fact that in 2024 part of the remuneration costs was capitalised within the framework of the GRES-1 Power Unit No. 1 project in the amount of 6,241 thousand KZT.

Financing costs, million KZT

25,244202331,322202435,369202543,4602026forecast

Forecast for the future In the forecast for 2026, financing costs amount to 43,460 million KZT. The increase was mainly due to raising funds under the bond programme at the CC to finance the costs of the AlES projects (CHPP-2, CHPP-3) and GRES-2, as well as attracting debt financing to cover cash gaps at GRES-1.

Share of profit of joint ventures and associates

Indicator, mln KZT 2023 (actual) 2024 (actual) 2025 (actual) 2026 (forecast)
Share of profit of joint ventures and associates 3,121 -5,856 9,712 10,789
Change in share of profit of joint ventures and associates
Financial performance chart Financial performance chart (5,855) Actual 2024 13,871 FM 1,873 GRES-2 175 ЕCHP, Altyn Dala 9,712 Actual 2025

Profit from equity companies for 2025 amounted to KZT 9,712 million, an increase of KZT 15,568 million compared to the same period, mainly for Forum Muider B.V. due to an increase in operating profit as a result of higher coal prices in the domestic and foreign markets.

Execution of covenants from external creditors

Liquidity and financial stability indicators

Covenant Standard 2022 Fact 2023 (actual) 2024 Fact 2025 Fact Note
Debt/EBITDA (ADB) not more than 3.5 2.14 1.74 1.62 1.92 Observed
EBITDA/Interest (ADB) not less than 2.2 5.92 10.80 12.23 14.44 Observed
Debt/Equity (DBK) not more than 2.0 0.50 0.43 0.49 0.62 Observed
Name 2020 Fact 2021 Fact 2022 Fact 2023 (actual) 2024 Fact 2025 Fact
Debt/EBITDA 2.96 2.41 1.90 1.71 1.66 1.86
Debt/Equity 0.54 0.59 0.50 0.43 0.49 0.62
Current Liquidity 0.75 0.53 0.57 1.04 1.00 1.45

At the end of 2025, "Samruk-Energy" JSC complied with the financial and non-financial covenants of creditors, which are fixed on a semi-annual basis.

At the end of 2025, "Samruk-Energy" JSC achieved the targets for financial stability ratios provided by the shareholder.

Growing debt load

The level of the Company's consolidated debt for 12 months of 2025 amounted to 601.50 billion KZT against the plan of 686.04 billion KZT, a deviation of 84.54 billion KZT. The main reasons for the decrease are the postponement of development dates for the CHPP-2 and CHPP-3 projects of AlES due to the postponement of gasification projects.

As part of further maintaining financial stability, "Samruk-Energy" JSC regularly monitors fundraising for the group of companies and takes measures to maintain the loan portfolio at a level that ensures the fulfillment of financial covenants, as well as to monitor the planned indicators of financial stability and analyze the impact of various borrowing conditions on the credit rating.

Also, in the coming periods, it is expected to increase the consolidated debt in order to implement priority projects aimed at ensuring the stability of the country's generation and gasification of the Almaty region.

Credit rating (Fitch Ratings)

On 30 September 2025, the international rating agency Fitch Ratings affirmed the Company's long-term foreign and local currency credit ratings at BB+, outlook Stable.

Specialist analysing financial performance

Benchmarking

Benchmarking is one of the important elements of the Company's management. The purpose of benchmarking is to compare operating and financial indicators with foreign peers to determine the Company's strengths and weaknesses. The following indicators were used for benchmarking

  • EBITDA margin
  • Debt/EBITDA
  • leveraged ratio (Debt/Equity)
  • Return on invested capital (ROIC)

For benchmarking, data from the following peer companies were used

  • PJSC Inter RAO (Russia)
  • CEZ Group (Czech Republic)
  • RWE (Germany).

Benchmarking results

CriterionMeasureStatusMin-------------------Benchmarking-------------------Max
EBITDA margin%
PJSC Inter RAO(13)
RWE(29)
CEZ(41)
SE

(42)
ROIC%
PJSC Inter RAO(12)
RWE(4)
CEZ(16)
SE(13)
Debt/EBITDACoefficient
PJSC Inter RAO(0.02)
SE(1.86)
CEZ(1.82)
RWE(3.87)
Debt/EquityCoefficient
PJSC Inter RAO(0.004)
RWE(0.47)
SE(0.62)
CEZ(1)
EBITDA margin for 2025
42%
"Samruk-Energy" JSC
41%
Cez Group
29%
RWE
13%
PJSC Inter RAO
Return on Invested capital (ROIC) for 2025
13%
"Samruk-Energy" JSC
16%
Cez Group
4%
RWE
12%
PJSC Inter RAO

Currently, compared to foreign analogue companies, "Samruk-Energy" JSC is inferior in some indicators.

Indicator EBITDA margin is a key indicator of the efficiency of a company's operations, reflecting its ability to generate earnings before interest, taxes, depreciation and amortisation. In comparison with other companies such as Inter RAO, RWE, CEZ Group, "Samruk-Energy" JSC demonstrates a high level of efficiency of operations with an EBITDA margin of 42%.

In terms of Debt/EBITDA and Debt/IC, Samruk-Energy JSC is at an average level compared to CEZ Group and RWE, but lags significantly behind Inter RAO in terms of financial stability.

In terms of ROIC (return on long-term invested capital), "Samruk-Energy" JSC is below CEZ Group, while above RWE and Inter RAO.

At the same time, it should be noted that, unlike public analogue companies, "Samruk-Energy" JSC belongs to the Government of the Republic of Kazakhstan, and therefore the Company is a conductor of the state policy in the field of electric power. In this regard, as well as with a high degree of depreciation of the energy sector, socially significant investment projects (aimed at the reliability and uninterrupted operation of the power system of the Republic of Kazakhstan) have been implemented since 2009, which led to a significant increase in invested capital and, accordingly, reduced the return on investment.

An additional factor affecting the return on investment indicators is the low level of electricity tariffs in the Republic of Kazakhstan in comparison with the countries of similar companies.

Average electricity tariff for 2025, KZT/kWh
30.97
Kazakhstan
44.46
Russia
183.32
Germany
147.91
Czech Republic
CountryAverage tariff per kWh9In KZT/kWhAverage exchange rate for 2025 10
Kazakhstan30.97 KZT30.97 KZT/kWh
Russia7.08 rubles44.46 KZT/kWh6.28 KZT/ruble
Germany€0.31183.32 KZT/kWh590.15 KZT/euro
Czech Republic6.18 CZK147.91 KZT/kWh23.94 KZT/CZK
  1. the average tariff for the end consumer in the Company's group is indicated, excluding VAT
  2. average exchange rate according to the National Bank of the Republic of Kazakhstan Source: Eurostat, Rosstat